应用计算机图像处理技术研究罗维朋标准色片与油脂颜色的关系,得到特征参数A(R-G)和B(R/G).固定罗维朋黄色片70时,很好的特征参数为B,其他情况下很好的特征参数为A.实验得出利用A或B计算罗维朋红值的经验方程,验证结果表明,不同油脂测定罗维朋红值与计算结果的相关系数大于0.98,平均误差小于0.4.
0前言
油脂是食品及工业的重要原料,其质量直接影响到产品的价格与销售.油脂颜色是油脂质量中最直接、最直观的质量指标,反映了油脂产品的质量以及储藏过程中品质的变化,而且是消费者选购油脂的重要According to.因此,颜色是油脂质量检验的重要指标之一.
油脂颜色的测定通常采用罗维朋比色法,国内有人通过测定油脂中叶绿素、叶黄素等色素含量确定油脂的颜色,也有采用高锰酸钾、重铬酸钾和碘溶液制作色阶,与油脂比较确定油脂的颜色[1],所有这些测定方法都带有主观性,而且操作烦琐.多年以来,在油脂测定的自动化方面有一定的发展,但仍然存在许多不足.
英国Tintometer公司于1984年推出罗维朋AF960自动比色计,该仪器既能测定欧洲色度标准黄20/红4,又能测定美国AOCS色度标准黄70/红20,但如果要得到较正确的结果需要将样品稀释,而且研究发现,AF960和目视罗维朋比色计AF710不能形成良好的相关性[2].2004年5月在美国辛辛那提召开的ISO国际会议上,油脂颜色报告中数据显示:罗维朋手动和自动测量的测量均值、标准偏差、重复性以及重现性都存在差异[3].
20世纪90年代初,日本研制出KC—560联机自动光谱油脂颜色测定仪.该仪器可以自动测定油脂颜色的变化;测定结果可以显示于屏幕,不会发生操作上的个人偏差,测定结果和罗维朋测定值相关性较好,但黄值总体误差较大[4].
In 1999, Sun Fengxia and others used computer image processing methods to successfully measure the color of peanut oil, rapeseed oil, cottonseed oil, soybean oil and sesame oil. Since the image processing avoided the subjective error of measurement, the same oil color was measured many times at the same time. The reproducibility and repeatability are good [5].
The author applies image processing technology to the determination of oil color, in order to find a fast, direct, objective and convenient detection method.
1 Materials and methods
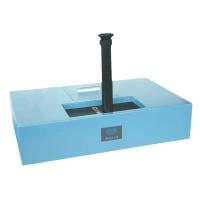
Lovibond Colorimeter, self-made image acquisition device; P4 computer, MATLAB data image processing software.
Oils with different colors: 5 parts of corn oil, 8 parts of cottonseed oil, 20 parts of sesame oil, 15 parts of rapeseed oil, 20 parts of soybean oil, and 20 parts of peanut oil.
Experimental steps: first, measure the R, G, and B values of different red and yellow tablets in the self-made image acquisition device, and find suitable experimental measurement conditions; second, measure the Lovibond value of the oil sample according to the national standard method; third , for different combinations of red and yellow slices, collect images, process and analyze them, and find out the characteristic parameters A(RG) and B(R/G) and their functional relationships that have a high correlation with the Lovibond value; fourthly, collect images of oil samples , The calculated value of the image processing is compared with the measured value of the sample to determine a good characteristic value at different yellow values, and finally the accuracy of the experimental results is verified with a new sample.
2 Results and Discussion
2.1 Comparison of the relationship between eigenvalues and Lovibond red values
Under other fixed conditions, experiments show that changes in brightness, contrast, and saturation have no effect on the results, so image acquisition is selected under default conditions.
Fix other experimental conditions, measure different , use MATLAB to obtain the R, G, and B values required for the experiment, and analyze these data to obtain that the characteristic parameters of the image B (R/G) and A The correlation between (RG) and the red value of Lovibond is relatively high. The relationship curves between each characteristic value and the red value of Lovibond are shown in Figure 1 and Figure 2.
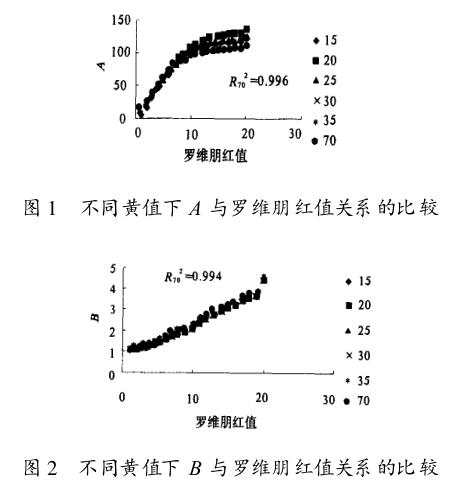
It can be seen from Figure 1 and Figure 2 that under different yellow values, the relationship between A and B and the red value is relatively close, but there are still differences, so for different yellow values, different mathematical function relationships need to be selected. For parameters A. Although the function curves are separated when the Lovibond red value is greater than 10, the correlation between each and the Lovibond red value is still greater than 0.99. Therefore, A and B are used as the selected eigenvalues in this experiment.
It can also be obtained that when the yellow value is 15, 20, 25, 30, 35, 70 , no matter A or B is selected for the characteristic parameter, the correlation coefficient between them and the standard unit value of Lovibond red film is above 0.99.
2.2 Repeatability of determination
When the yellow values are 25 and 30 respectively, the results of four measurements of characteristic parameters A and B are shown in Figure 3 and Figure 4.
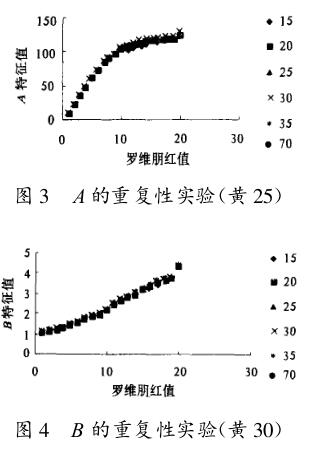
It can be seen from Figure 3 and Figure 4 that the error of each repeated measurement is uniform, which may be caused by the stability of the device, and the overall repetition of the experimental measurement is high, which ensures the feasibility of the application. Similarly, for the Lovibond yellow value of 15, 20 When , 35, and 70, the repeatability measurement results are consistent. In general, the standard deviation for characteristic parameter A is less than 3, and for B is less than 0.06.
2.3 Selection of eigenvalues
When the yellow value is fixed at 70, the relationship between the measured value and the calculated value of Lovibond of the oil sample is shown in Figure 5 and Figure 6.
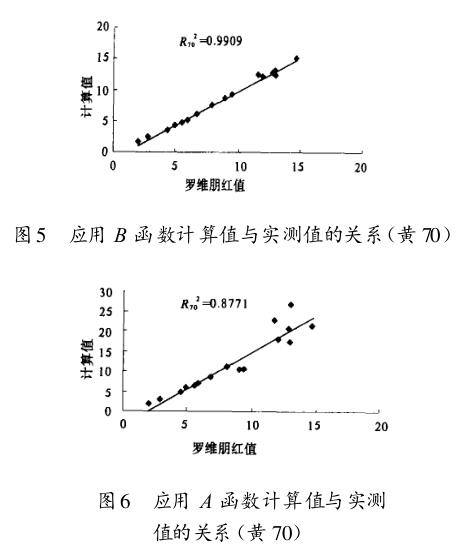
The required characteristic parameters are very good. The experiment shows that when the yellow value is 15, 20, 25, 30 and 35, A is a good experimental characteristic value. When the yellow value is 70, you need to choose B as the experimental characteristic value. .
The final functional relationship of the experiment is:
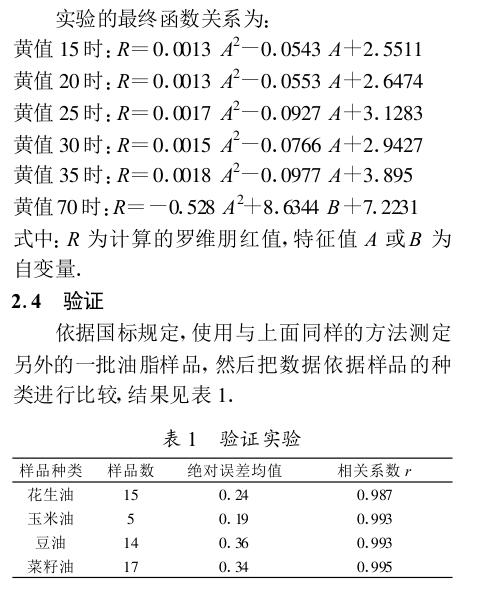
3 Conclusion
Using the image processing technology, the Lovibond red value of the oil color can be calculated according to the characteristic value B or A of the oil variety. The objective measurement of the oil color is feasible, and the subjective error of the Lovibond Colorimeter is avoided. Due to the image processing technology Versatility, the precipitation and suspended matter in the oil sample can be processed, so this method does not have high requirements for the oil sample. If collected image is compensated and further processed, the experimental results will be more satisfactory.