1 Introduction
There are many factors affecting the pigment performance of titanium dioxide, among which particle size and distribution are one of the most important influencing factors. The particle size of titanium dioxide particles seriously affects its scattering coefficient. When the particle size is 200 nm, the scattering coefficient is the highest. At this time, the color reduction power and hiding rate of the pigment are better, and the whiteness and gloss are better. However, when the particle size becomes smaller, the weather resistance will decrease accordingly. For titanium dioxide with excellent pigment performance, the particle size distribution width of its particles should be as narrow as possible. Accurate detection of particle size distribution of titanium dioxide can preliminarily judge the quality of intermediate products and finished products from the distribution diagram, which is beneficial to guide the production of titanium dioxide. In the 1960s and 1970s, some titanium dioxide factories at home and abroad mostly used sedimentation method and electron microscope to measure the particle size distribution of titanium dioxide. The sedimentation method has many influencing factors, and the measurement results are very different; the electron microscope method needs to use a large number of statistical tools to obtain a particle size distribution that is closer to the actual situation, otherwise there will be limitations. In recent years, analytical instruments developed by liquid phase adsorption method and air infiltration principle have been used to measure the particle size distribution of titanium dioxide, which has greatly improved the analysis speed and accuracy. In 1975, the British Malvern Company developed the world's first laser particle size distribution analyzer. In the early 1980s, it first professionally entered the field of petrochemical industry in my country. , battery and military fields are widely used. At present, laser particle size distribution analyzers are rarely used in the titanium dioxide industry. This paper studies the measurement conditions of the particle size distribution of titanium dioxide by the laser particle size distribution analyzer of the British Malvern company, finds out the factors that affect the measurement, and determines a stable measurement system. The method is simple, rapid, accurate and reproducible, and it is suitable for the determination of the particle size distribution of titanium dioxide, which is beneficial to guide the production of titanium dioxide and the quality assessment of finished products.
2 Experimental part
2.1 Reagents and instruments
Sodium hexametaphosphate (0.05%); special sample cell (1 cm); ZE-TASIZER 3000HS particle size distribution analyzer; D-78224SINGEN/H&W ultrasonic disperser; water (both double distilled water).
2.2 Test method
Weigh 0.2 g of titanium dioxide sample into a 250ml beaker, add 50 ml of sodium hexametaphosphate solution, shake well, disperse in an ultrasonic disperser preheated for 10 minutes for 10 minutes, shake well, and drop it with a dropper Put 2-3 drops in a 100 ml beaker, dilute it with sodium hexametaphosphate solution until the concentration displayed on the instrument is 50-150, pour it into a cuvette, preheat it for 5 minutes and measure it.
3 Results and discussion
3.1 Selection of dispersant
The dispersibility of sodium thiosulfate, trisodium phosphate and sodium hexametaphosphate was tested respectively, and it was found that the dispersion effect of sodium hexametaphosphate was better, and the dispersion system formed with titanium dioxide was stable. Therefore, sodium hexametaphosphate was selected in this paper. as a dispersant.
3.2 Selection of dispersant concentration
Weigh 0.05, 0.1, 0.2, 0.5, 1.0, 5.0 g of sodium hexametaphosphate respectively, add 100ml of water to dissolve in a 250ml beaker, then take 0.2g of titanium dioxide in the above dispersant, disperse for 10 min, and let stand. The dispersion was observed, and the results are shown in Table 1.
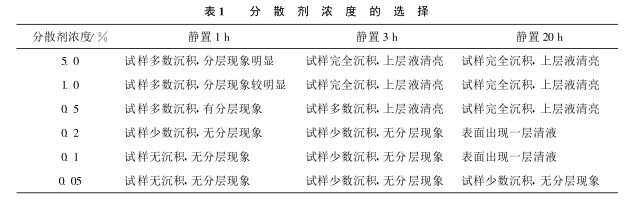
It can be seen from Table 1 that when the concentration of dispersant is 0.05%, the dispersion effect is good and the system is the most stable.
3.3 Determination of sample size
Weigh 0.2, 0.5, 0.7, 1.0 g titanium dioxide samples respectively, measure the particle size distribution and observe the system stability after standing still. The test results show that the 0.7 g and 1.0 g sample systems are unstable, and the peak width changes greatly; the 0.2 g and 0.5 g sample systems are stable, which truly reflect the particle size distribution of titanium dioxide. In order to reduce the dilution of the sample concentration, the sample volume was determined to be 0.2 g.
3.4 Determination of dispersion time
Weigh 0.2 g of titanium dioxide sample, disperse for 5, 10, 15, and 20 min in turn, measure its viscosity distribution and observe it standing still. The results showed that: after dispersing for 5 minutes, some samples were not well dispersed, and the average particle size was obviously too large, and there was sedimentation after standing for 1 hour; after 15 and 20 minutes of dispersing, the dispersing temperature rose rapidly, which seriously changed the measurement temperature, so the dispersing 10 minutes is appropriate.
3.5 Determination of warm-up time
Weigh 0.2 g sample, preheat for 2, 5, and 10 min respectively, and then measure the particle size distribution. It was found that after preheating for 5 minutes, the system reached stability, and the measured peak width and average particle size were more appropriate, so the preheating time was determined to be 5 minutes.
3.6 Determination of analysis software
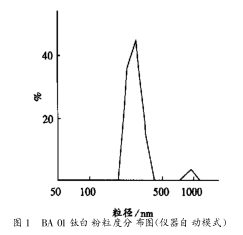
3.6.1 Instrument Auto Mode
If the automatic analysis mode of the instrument is selected, some irregular patterns (double peaks or multiple peaks) will appear according to the characteristics of the sample and the analysis environment, see Figure 1. It can be seen from Figure 1 that the particle size distribution of the sample can be seen from the large peak, and the small peak indicates that the sample has larger particles or the analysis environment dust has fallen into the sample measurement system. At the same time, the automatic analysis mode can reflect the percentage of the sample.
3.6.2 Multimodal mode
The above samples were analyzed in multi-peak mode, as shown in Figure 2.
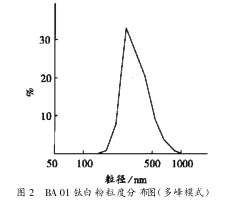
The multi-peak mode can reflect the particle distribution gradient of the sample, and at the same time reflect the particle volume percentage of the sample.
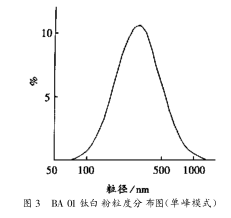
3.6.3 Single peak mode
The same sample above was analyzed in single peak mode, as shown in Figure 3. Apparently, the unimodal mode is the fitting of the above two modes, and it is a normal distribution curve, which can reflect the basic situation of the particle size distribution of the sample more intuitively.
4 Sample Analysis
4.1 Determination of particle size distribution of standard samples
Put two drops of standard sample in a 250 ml beaker, and measure its particle size distribution according to test method 2.2. The experimental results are shown in Table 2.
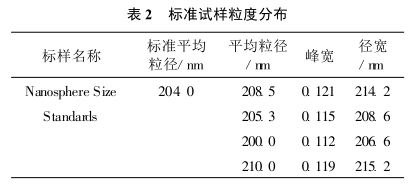
It can be seen from Table 2 that the determination of standard samples using this system has high accuracy and good reproducibility.
4.2 Determination of particle size distribution of titanium dioxide samples
According to the test method 2.2, the particle size analysis of different grades of titanium dioxide is carried out, and the experimental results are shown in Table 3.
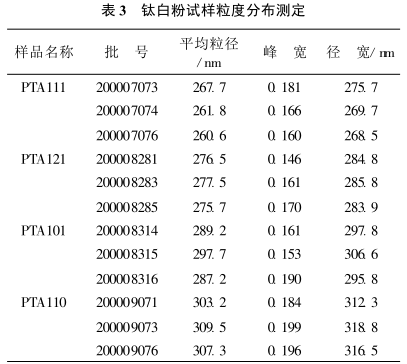
It can be seen from the results in Table 3 that this method has good reproducibility and satisfactory results for the determination of the average particle size of titanium dioxide.
4.3 Accuracy experiment
Take the same batch of samples and carry out the accuracy test according to the test method 2.2. The results are shown in Table 4.
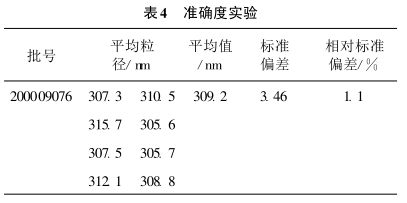
It can be seen from Table 4 that the accuracy of this method is good and the results are satisfactory.
4.4 Comparison of the measurement results of several analytical methods
The results of several analytical methods are compared in Table 5
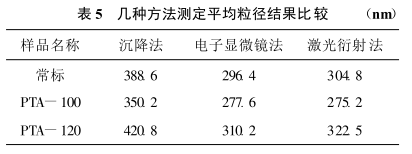
It can be seen from Table 5 that the results of the sedimentation method are obviously higher, while the results of the electron microscope and laser diffraction methods are similar. However, since the electron microscope method requires a large number of statistical tools after the measurement is completed, otherwise the results are relatively limited. Therefore, the determination method studied in this paper can accurately determine the particle size distribution of titanium dioxide, and has strong practicability.
5 Conclusion
In this paper, the determination method of particle size distribution of titanium dioxide is studied by laser particle size analyzer, and the influencing factors such as dispersant, dispersant concentration and dispersion time are determined through experiments, so as to establish a stable measurement system. The method is simple, rapid, accurate and reproducible, and it is suitable for the determination of particle size distribution of titanium dioxide with satisfactory results.
