Sediment grain size data are widely used to identify depositional environments and analyze sediment transport processes. The traditional particle size analysis methods are sedimentation method (such as pipette method) and sieve analysis method. With the development of technology, new methods are constantly produced. In the 1970s, some scholars proposed to use the principle of optical diffraction to test the particle size of particles, thus the laser particle size analyzer was born. At present, the laser particle size analyzer has been continuously developed and widely used at home and abroad. In order to reasonably use and compare the granularity data tested by different methods, it is necessary to understand the differences and reasons between these methods. This paper mainly analyzes and evaluates the test results of laser particle size analyzer through experimental research, and compares them with sedimentation method and sieve analysis method.
1 Principle and operation
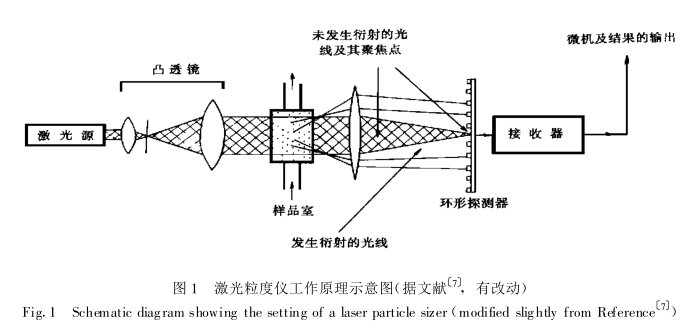
The working principle of the laser particle size analyzer is based on the interaction between light and particles. In the light beam, spherical particles of a certain size scatter light forward at a certain angle, which is close to the diffraction angle produced by pores equal to the particle diameter. When the monochromatic light beam passes through the suspended particle flow, the diffracted light generated by the particles is collected on the Detector through a convex lens (Fig. 1), and the scattered light intensity at different diffraction angles is recorded. At the same time, the light that does not diffract is focused on the center of the Detector by the convex lens, which does not affect the diffracted light, so a stable diffraction spectrum is generated when the particle flow passes through the laser beam. The intensity I(θ) of the diffracted light has the following relationship with the particle size:

where θ is the scattering angle, R is the radius of the particle, I(θ) is the light intensity scattered at the angle θ, n(R) is the particle size distribution function of the particle, K = 2π/λ, λ is the wavelength of the laser, J 1 is the Bayesian function of the first type.
According to the measured I(θ), the particle size distribution n(R) can be obtained by inversion of equation (1). For detailed equation solution, see literature [3, 4, 5].
In this study, the Cilas940 L laser particle size analyzer produced by Cilas Company of France was used. In addition to the detection part shown in Figure 1, the main components of the Cilas940 L laser particle size analyzer also include a water injection tank (including a mechanical stirrer), an ultrasonic oscillator and a peristaltic pump. During the test, put the pretreated sample into the water injection tank, form a suspension solution through ultrasonic and mechanical dispersion, and form a continuous suspended particle flow driven by the pump, the particle flow passes through the laser beam from the sample chamber, and the diffracted light is emitted by the detection The Detectors record and input into the microcomputer, and the final test result is output by the microcomputer. The entire operation process is controlled by a microcomputer, and the average testing time for each sample is about 5 to 7 minutes. The main performance parameters of Cilas 940 L are shown in Table 1.
2 Materials and methods
The samples studied in this paper include the muddy deposits in the middle of the North Yellow Sea, the beach sand of Yuehu Lake in Rongcheng, Shandong, and the 502 microbeads (grain size range 0.038-2 mm) produced by Shanghai Glass Factory. order and other types of laser granularity


The loess samples from Xuancheng, Anhui and the laterites from Xinyu, Jiangxi were also collected. These samples have been tested with the FRITSCH Analysette22 (hereinafter referred to as FA22) laser particle size analyzer in the State Key Laboratory of Loess and Quaternary in Xi'an. All samples were added with 0.05 N sodium hexametaphosphate solution and dispersed by ultrasonic wave before testing. The loess and laterite samples were also pretreated as follows: add 10% H 2 O 2 10ml and boil until the reaction is calm, cool down; add 10% hydrochloric acid 10ml to boil, inject distilled water, and let stand overnight. Pump out the distilled water, wash off excess hydrochloric acid, and wash repeatedly to effectively remove acid ions. The operation steps of the sedimentation method (pipette method) were carried out according to the 1975 "Marine Survey Specification" issued by the State Oceanic Administration. The particle size parameters were calculated using the method of moments.
3 results
3.1 Repeatability of measurement results
Repeatability refers to the degree of coincidence between the measurement results obtained after the same sample has been measured multiple times, and it is an important indicator reflecting the accuracy of the instrument. Two methods are adopted in this study: first, take a sample and put it into the instrument for 10 repeated measurements; second, take 10 sub-samples and measure 10 times respectively. The samples used in the experiment are muddy sediments in the North Yellow Sea, and the experimental results are listed in Tables 2 and 3. According to the statistics of the test results, in the repeated test results of a single sample, the standard deviation is very small (<0.04), and the skewness is slightly larger than 0.14. From the perspective of standard deviation/average, the variation of skewness is large, and the variation of other parameters is less than 2%, among which the median particle size and average particle size fluctuate only about 0.5%, which shows that the repeatability of instrument measurement is very high . Taking 10 sub-samples for measurement, similar results were obtained, and the variation of each particle size parameter was slightly higher than the test results of a single sample on the whole. This is mainly due to the error caused by sampling. The laser particle size analyzer needs to dilute the particle flow below a certain concentration during the test. The required sample volume is very small, and it is difficult to be fully representative if the sample volume is too small. From the test results of the two methods, compared with the performance of the instrument itself, the error caused by sampling is more significant, that is, the selection of sub-samples is the main factor affecting the measurement accuracy of the laser particle size analyzer.
3.2 与沉降法的比较
激光粒度仪测试细颗粒组分的含量与沉降法相比有一定的差异。Malvern 3600E 激光粒度仪测试粘土(<2μm)含量的效率(即激光粒度仪测试的百分含量与沉降法的比值)为 16%~ 20% , 而 Coulter LS-100激光粒度仪的测试效率为 36%~ 70%。本文研究中用沉降法(移液管法)测试了 15 个北黄海泥质样 ,粘土含量的测试结果明显高于 Cilas 940 L 激光粒度仪(图 2)。According to对 15 个样的统计, Cilas 940 L 测量<8 (4μm)组分的效率为 46.7%~ 70.5%, 平均为60%,而对于 <9 (2μm)部分 , 测试效率为 25 .6%~47 .9%,平均为 37.3%。


3.3 与筛析法的比较
本文研究中, 选取了 16 个标准圆球体玻璃珠样品 ,分别用筛析法和激光粒度仪进行测量 ,所得的平均粒径十分接近(图 3), 标准离差仅 0.057, 相关系数为0.98,斜率近于 1,截距近于 0,可以认为两者的测试结果基本相当 。
然而,天然沉积物多为不规则形状的颗粒。为了分析不规则形状对测试的影响, 我们分别筛分了玻璃珠和海滩砂,然后在筛分所得的不同粒径样品中分别取相等重量的玻璃珠和海滩砂 , 配制了两组样品。每组中的两个样品按筛析法 ,它们的粒径分布是全一致的。然而激光粒度仪测试结果显示, 海滩砂平均粒径比玻璃珠更粗一些(图 4)。也就是说, 对于不规则形状的颗粒, 激光粒度仪测试结果比筛分法偏粗 。从原理上看 ,激光粒度仪测试所得的颗粒的粒径相当于相同衍射角的 球体直径 , 它 是颗粒截 面积的函数 。Jonasz 指出 ,不规则颗粒的截面积平均起来要大于相同体积的球体。因而, 激光粒度仪测定的不规则颗粒的直径比相同体积的球形颗粒大。此外, 就筛析法而言,理论上能通过筛孔的圆球体颗粒,其最大直径将等于筛孔直径,但是由于通常使用的筛孔均为方形孔 ,对于不规则的沉积物 ,只要中径小于或等于筛孔边长L 的颗粒就可能通过 。由于沿筛孔对角线方向的孔径为 L ,因此,在某些极端的情况下, 中径等于 2L 的颗粒也将通过筛孔。所以, 如果以颗粒的中径决定能否通过筛孔的话, 则这个中径乃是介于 2L 和 L 之间的值。筛分所得的某一粒级的不规则颗粒的平均粒径要大于同一粒级的球形颗粒, 即筛分所得不规则颗粒的粒径偏细。综合上述两个原因 , 激光粒度仪测试不规则颗粒的粒径比筛析法偏粗。因此 ,对于形状不规则的颗粒,激光粒度仪与筛析法测试结果上的差异来源于这两种方法的原理 ,在两种方法中,对颗粒的粒径的定义是不同的。
3.4 与 FA22 激光粒度仪的比较
不同厂家生产的激光粒度仪之间测试结果也有一

定差异 ,本文研究比较了 Cilas 940 L 和 FA22 激光粒度仪的测试结果(图 5)。样品使用安徽宣城黄土和江西新余红土。两种激光粒度仪测试的平均粒径有较好的相关性(相关系数为 0.84),但 Cilas 940 L 测得的平均粒径比 FA22 略细一些 ,原因可能在于对粘土含量的测试上。According to 16 个样品的统计 ,对于 <8 和 <9的组分 , FA22 测得 的含量分 别是 Cilas 940 L 的82.5 %和 82.6%, FA22 测量粘土含量的效率略小于Cilas 940 L 。

4 讨论
4.1 粘土含量的测定
激光粒度仪测定粘土组分的含量较沉降法偏低,其原因主要有三 。
(1) 激光粒度仪的测量范围 。Cilas 940 L 可测量的范围为 0.3~ 2000 μm , FA22 为 0.1~ 1 250 μm ,而沉降法在理论上没有最小测量粒径 。因此 ,有一部分很细的颗粒 ,激光粒度仪测量不到 。如果这一部分颗粒在整个样品中占有较大比例的含量, 则会带来一定的测量误差。
(2) 反解方程(1)所用的方法。早期的激光粒度仪使用 Fraunhofer 衍射理论, 但是 Fraunhofer 理论只适用于粒径大于激光波长的颗粒。事实上 ,当颗粒粒径小于 10 倍的激光波长时 ,Fraunhofer 理论就已不太适用了, 这时需要用完全的 Mie 理论。现代激光粒度仪大多同时考虑了两种理论, 然而 , 测定的粘土组分的含量仍比沉降法偏低。
(3) 测试原理和颗粒形状 。沉降法测定的是According to Stokes 定律的当量直径, 反映颗粒的沉速 ;而激光粒度仪测定的是According to光学衍射原理的当量直径, 反映颗粒的横截面特征 。这两种方法测量的是同一颗粒的不同特征。对于非球体这两个特征之间的差异十分显著 ,因而造成了两种测量方法测量结果之间的差异 。Konert 和 Vandenberghe 指出粘土矿物的颗粒形状极不规则 , 多呈片状和圆板状 ;According to Stokes 定律可以计算出 ,一个直径 7.9 μm 、厚 0 .2 μm 的圆板状颗粒, 它的沉降速度相当于一个直径 2 μm 的球体 〔13〕 , 也就是说按沉降法它将被视为直径 <2 μm 的组分。因此, 天然沉积物中有相当部分不规则的细颗粒沉积物, 按沉降法为粘土组分, 而用激光粒度仪则成为大于粘土粒级的组分 。我们将 Cilas 940 L 激光粒度仪测试的 <8 的组分含量与沉降法测得的 <7 的组分进行比较 ,可以看出两者的数值相接近,相关性很好(图 6), 表明激光粒度仪测定的 <8 的组分含量与沉降法测得的<7 的组分相当 。此外 ,本文研究还用激光粒度仪测试了两个用沉降法提取出来的粘土级沉积物(<8 ),它们的粒配分布有相当部分超过了 8 (图 7)。图中所示的两个同粒级样品的粒配曲线不尽相同,大于 8 的含量也有差异 。这是因为这两个样品取自不同的站位,其物理特性有所不同 ,如颗粒的密度 、形状等, 而这些因素直接影响了它的沉降速度 。因而 , 同为沉降法提取的相同粒级的沉积物 ,用激光粒度仪来测也有不同的结果。According to上述分析 ,由于天然沉积物的不规则形状和两种测试方法原理上的不同, 一些细颗粒物质被激光粒度仪和沉降法所“识别”的粒径大小是不同的,这是造成两种方法在测量粘土组分含量上差异的一个重要原因

4.2 粒度参数的比较
粒度参数是经常用以反映沉积物粒径分布的统计参数 。如前所述 ,激光粒度仪的测试结果与沉降法 、筛析法有一定的差异, According to它们的测试结果所计算的粒度参数也会不尽相同 。图 8 比较了这三种方法测试结果所得的平均粒径和分选系数 。因为激光粒度仪测试粘土组分的含量较沉降法偏低, 因而平均粒径相对较粗 ;分选系数比沉降法要高 , 显示分选较差, 这也许表明细颗粒组分的分选程度比粗颗粒组分要高。从 15个样品的结果来看 ,它们的变化比较接近 ,具有一定的相关性 。16 个玻璃珠样品经筛析法和激光粒度仪测试的平均粒径十分接近 ,但筛析法的分选系数较低, 分选较好 。它们之间的变化比较接近。图中没有显示偏态和峰态系数的变化, 总的来说 ,激光粒度仪测定的偏态与沉降法 、筛析法的相关性较差,而峰态的相关程度与分选系数接近。
图 8 的结果显示, 虽然激光粒度仪与沉降法 、筛析法的测试结果有一定差异, 但粒度参数的变化趋势却比较接近 。由于本研究所用的样品数量有限, 还不能认为上述结果是普遍的规律, 各种测试方法所得的粒度参数之间的相关性还有待进一步的研究 。但就已有的结果来看 ,不同测试方法所得数据有其自身的系统规律 。因此, 沉积物粒度数据的比较应保持在同一测量系统之内 ,According to某个测量系统的粒度数据建立起来的反映沉积环境、沉积物输运过程的规律 ,在运用于其他测量系统的测试数据时 ,要进行适用性分析。不同测量方法所得的测试结果之间的比较 ,可采用数理统计的方法 。本文研究中 , 进行了一些相关分析 , 但这些回归公式并不具有普适性, 因为沉积物具有区域性 ,不同区域的沉积物 ,物理特性不同 。
4.3 不同测试方法的准确度和准确度
不规则颗粒的粒径可以According to其不同的特征予以确定 ,如颗粒的横截面积、沉降速度 、体积以及能穿过的洞的孔径。不同的粒度分析方法According to于这些不同的特征 ,而且这些特征之间缺乏确定的关系。因此, 对于同一颗粒, 不同方法测定的粒径不尽相同。由于目前并没有一个对非球体颗粒粒径的统一定义, 因此不同方法的准确度难以比较。


从操作的误差来看 ,沉降法(移液管法)的精度是不高的,除了操作方法本身的缺陷之外 ,人为因素带来的误差也可影响测试结果之可靠性 。因而这种方法被认为“对确定泥质样品中粉砂的大致含量还是有用的” 。筛析法沿用已久 ,对于不规则的天然沉积物,实际能通过筛孔的颗粒大小是由其中径所决定的(详见前文论述)。此外 ,筛孔变形、沉积物在机械振荡过程中的破碎以及沉积物之间密度的差异 , 都会增加测量结果的误差。相比而言 ,激光粒度仪的系统误差要远小于沉降法(移液管法)和筛析法 。此外 , 本文研究所用的 Cilas 940 L 激光粒度仪的测量范围涵盖了砂以下的粒级(海洋沉积、湖泊沉积和风成沉积的粒级一般在这个范围之内),可以避免不同测量方法之间匹配时产生的误差。
目前 ,粒度测试技术正处于迅速发展的阶段, 新仪器不断涌现 。这些仪器与传统的沉降法和筛析法相比,测试效率高 、操作简单 ,而且精度可靠,具有一定的优越性 。当然, 不同类型仪器之间测量结果的差异也是存在的。Sivitski 等综合比较了各种测量方法之间、同种方法不同类型仪器之间的测试结果, 认为总体上新型的粒度仪优于传统的沉降法、筛析法 。在众多可选择的粒度分析方法和仪器面前, 重要的是要了解它们的缺陷和不足, 以便合理使用 、分析其测试结果 。
5 结论
通过实验研究 ,分析了 Cilas 940 L 激光粒度仪的测试结果并与沉降法、筛析法进行了比较 。结果表明:
(1) 激光粒度仪的测试结果的重复性很好 ,具有较高的测量精度;影响其精度的主要因素是子样的代表性。
(2) For glass bead samples, the test results of the laser particle size analyzer are very close to the sieve analysis method. For natural sediments, the average particle size measured by the laser particle size analyzer is coarse and the separation is biased.
(3) The content of the clay component (<8 %) determined by the laser particle size analyzer is 46.7% to 70.5% of the sedimentation method, with an average of 60%. For the <9 part, the test efficiency ranged from 25.6% to 47.9%, with an average of 37.3%. The average particle size measured is thicker than that of the sedimentation method, and the separation is biased.
(4) The reason for the difference between the laser particle size analyzer and the sedimentation method and the sieve analysis method mainly lies in the principle of these test methods and the irregular shape of natural sediments.
