summary
Before the application of the protective coating, the steel surface is often cleaned by abrasive impacts. The resulting surface profile, sometimes referred to as anchor grain, consists of complex peak-to-valley patterns that need to be precisely evaluated to ensure compliance with job or contract specifications. Measurement parameters include peak, peak height, density, and increased surface area (roughness).
In the protective coatings industry, replica tapes are widely used to quantify surface profiles. However, as with most other means of field measurements, tape can only determine the maximum profile height. Other measures of surface texture that do not make sense can be obtained using electron or laser confocal microscopy or laser interferometer, but these large, complex, expensive instruments are not suitable for use in the field.
The replica tape provides a reverse copy of the blasted steel surface. This article re-examines the ± of coating professionals required to replicate tape as a source of additional surface profile parameters. It explains how to use simple, low-cost field devices to gain valuable new information from replica tapes.
Keywords: surface; Contour; Copy; Adhesive tape; Roughness; Adhere to; roughness
Brief introduction
A random irregularity of irregular peaks and troughs on the surface of the blasted steel surface (Figure 1). The characteristics of the blasted surface are indicative of the adhesion of the paint. If the peak-to-valley roughness is insufficient, the paint will not stick. If the peak-to-valley roughness is too large, the high peaks may protrude through the paint and become corrosion foci.

Figure 1: Computer-generated image of sandblasted steel surface (left). The surface of the bomb (right).
A variety of measurement methods are available to coating professionals, including focusing microscopes, surface comparators, depth micrometers, and stylus roughness meters. Each one provides a portion of the information. It is advisable to obtain the necessary parameters from a practical source. This article examines replication tapes as a possible source.
Replica tape
Replica tape is a known method for characterizing surfaces. It is simple, relatively inexpensive, and has a good correlation with the results of other methods. It's special It is not suitable for measurements on curved surfaces that are difficult to measure directly with a stylus instrument or an interferometric laser scanning or optical focal length measurement device. Therefore, it is not surprising that it has become a very popular method for measuring surface profiles. Its operation is described in several international standards d44171 including ASTM, ISO 8503-52, NACE rp02873, and 3894.54.
The replica tape consists of a layer of compressible foam pasted with a highly uniform thickness of an incompressible polyester substrate (50 μM + 2 μm). When pressed against a rough steel surface, the foam forms an impression or reverse replica of the surface. The foam can be folded to about 25% of the pre-collapse thickness. Thus, as the highest peak on the original surface is pushed onto the polyester backing, the fully compressed foam is displaced sideways. Similarly, the deepest valley of the original creates the highest peaks in the replica.
Compressing the band (copy) between a spring micrometer anvil and subtracting the contribution of the incompressible polyester matrix (50 μm) gives a measured average maximum peak-to-valley surface roughness profile (Figure 2)

Figure 2: How to copy the work on tape
Replica tapes are available in different thicknesses to facilitate profile measurements in different ranges. The main range for replica tape measurements is 20 to 115 μM by two-stage tape as follows:
1、64μm~20μm
2、x-coarse 38~115μm
Advantages and disadvantages:
Replication tapes have been evaluated since the late 1960s compared to other methods of sandblasting the roughness profile of the steel surface, with the advantages of robustness, relatively low start-up costs, good repeatability, and maintaining a physical copy of the surface. The method is widely applied and widely understood.
An added benefit that sometimes comes with a talent is that, unlike the tip probe technique, the replication method of the sample is a continuous two-dimensional region large enough to produce powerful statistics. A single electronic surface roughness meter scan, e.g., a sample line along a sandblasted surface, 12.5 mm long and 10 μm wide, with a total area of 0.12 mm². A single copy of the styrofoam sample is about 31 square millimeters and an area of more than 250 times.
However, there are drawbacks to these advantages. Most notably, this replication method and the associated thickness determination are simulation programs where each grade or thickness of the tape is accurate and has only a limited range of heights. Occupations that span the greatest range of interest in coating and lining (about 20 to 115 μm) require two-stage tape, "coarse" and "x-coarse".
An unfortunate feature of the copy comes with that the measurements are accurate in the middle of each level range and accurate at the outer end of each level of range (Fig.). That's why the other two grades, coarse minus (< 20 μm) and X-Coarse plus (> 115 μm), are used to check and, if necessary, to adjust the main range of measurements at the upper and lower ends.

Figure 3: Nonlinearity of the replication tape
At the end of each tape grade range, the reason for the linearity disappears is related to how the tape compresses in these areas of thickness. With each thickness, or grade, tape becomes less accurate because the peak that needs to be replicated is close to the full thickness of the replicated foam. When measured with a micrometer, the peak is compressed into a peak height average. This limits the accuracy at the upper end of the scale range. Confined to the low end of its range is a fact, like a tightly squeezed kitchen sponge, replicating the foam to reach a state of full compression, perhaps a little relaxation (Figure 4). As a result, the response of the replicated foam to compression is not linear to the degree of compression, whether in the upper or lower part.

Figure 4: Reasons for the nonlinearity of the replication tape
Corrections to improve accuracy
The upper coarse range and the lower limit of the X-Coarse grade interval share 38 to 64 μM "overlapping" regions (Figure 5). The professional describes the relatively complex and time-consuming process of the current instruction (one reading using coarse grade and reading using x-coarse grade average) that is used to weave coarse x-coarse sub-ranges together to achieve reasonably accurate readings over a large range of 20-115 μm. This recipe is a compromise between accuracy and ease of use.


Figure 5: 2 overlapping areas at the replication ribbon level
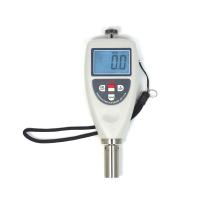
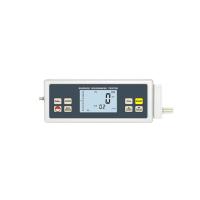
Alternatively, the drawbacks imposed by the nonlinearity and finite range of the two tape-level subranges can be compensated by the processor's use of a "lookup table". This is not a simple spring micrometer option (6). Electronic instruments using powerful processors can provide the user with a traditional direct reading of the copy thickness (H) or a linear measurement of the surface profile height (HL) using the adjustment value.

Figure 6: Analog spring micrometer (left) - digital spring micrometer (right)
The instrument's processor, when switched to "Linearization" mode, HL, guides the user through any necessary readings (usually requiring a "coarse" or "x-coarse" level copy insertion) and returns a measurement to adjust the nonlinear response of the foam. This linear adjustment tends to be small (in order of standard deviation), but the main advantages of the device's signal conditioning are reduced measurement uncertainty, reduced inspector workload and potential for error, and a reduction in the number of replicas required by the inspector to ensure accuracy. In addition, since each grade level tape is actually on a larger scale than what is stated on the label, the appropriate adjustment factor X-Coarse grade can be used to measure the nominal coarse distance and vice versa.
Three-dimensional surface diagram
Interestingly, with this improved profile height information, there are still more surface feature data contained in the copy of the 31 square millimeter area. Important new data can be obtained through digital imaging.
One property of tape, which has to do with its ability to replicate surfaces, is the increase in the transmission of compressed light. The transmission of light is directly proportional to the degree of compression. A backlit copy strip reveals the highlighted compressed photograph (peak) and the lower compressed dark area (valley) (Fig.7a).
Using this transparency principle, the peak count can be determined by simply counting the bright spots on the impression produced by the digital image sensor. These luminance measurements (each size equivalent to a 5-micron probe of a stylus profile measuring device) correspond to thickness measurements, which in turn reflect the contour of the original surface. A suitable algorithmic tool running on a processor can identify and determine peak area peak density, i.e., how many peaks are per square centimeter, or PD, as defined by ASME b46.15.
Instead, stylus analyzers, replicating counters with peaks, like delicate and expensive lab-grade optical interferometers, calculate true two-dimensional peak densities. The probe profilometer measures only one line on a rough surface and most of the features, it records that the "peak" is actually the "shoulder", and the pen traces the side of the summit rather than at the summit.
Another advantage of these images is that more data is used to obtain each measurement (1,000,000 points for a single copy tape measurement versus 5,000 points for a single 2.5 cm dot scan). In addition, it is all done with rugged field instruments, using inexpensive hardware to obtain surface characterization data similar to that obtained with laboratory instruments.

(a)
Figure 7: 2D and 3D images exported from the copy tape
Using 3D rendering software to apply the thickness/transparency relationship to the interpretation of intensity images, more surface feature parameters can be extracted. The result is a three-dimensional map of the blasted steel surface at a much lower cost than the interferometric analysis equipment (Fig.7b).
While the peak height and peak count factors in the long-term adhesion of the coating contribute to a more basic basic parameter: surface area6, or SDR.
From the three-dimensional image, the increase in surface area caused by the blasting operation can be measured. SDR is a three-dimensional field parameter that gives the ability of professionals in the relevant application technology ±to provide the coating with a roughness value – blasting as a percentage of the additional surface area (actual area/work area)7.
conclusion
A simple, low-cost, portable device that uses thickness and imaging sensors can characterize replica tapes and generate images and statistics of the original surface. These parameters include:
Measure the average of the maximum peak-to-valley distance of the thickness of the replicated band with a micrometer or thickness sensor.
HL - A more accurate peak-to-valley height measurement adjusts the tape to be non-linear, without the need to average 2 or more copies. This approach helps to expand the range of each level of replication tape.
PD – Area Peak Density per ASME B46.1. This value is often cited as an indicator of the amount of mechanical connections available for anchoring protective coatings.
SDR - The developed interfacial area ratio represents the measurement area for the additional surface area contribution provided by the texture compared to a satisfactory planar size. Images - 2D and 3D renderings of the reproduction tape surface for documentation purposes.
cite
1. ASTM D4417 standard test method for steel surface profile measurement after sandblasting (ASTM, Bal Harbour 100 Drive, West Conshjokken, PA 19428)
2. "ISO 8503-5 Characteristics of surface roughness of steel surface for preparation of steel substrates for spray cleaning before application of coatings and related products: 5 parts of the replication tape method for surface profile determination" (International Organization for Standardization (ISO), 1 rue de varembé Post, Case 56, CH-1211, Geneva 20, Swiss ±)
3. NACE standard RP0287-2002, "Replica tape is used for on-site measurement of the surface of sandblasted steel". (American Society of Corrosion Engineers (NACE), 1440 South Creek Bo±, Houston, TX 77084-4906 USA)
4. Australian Standard 3894.5-2002, "Protective Coatings, Field Test Method 5: Determination of Surface Profile". (Australian Standard, P.O. Box 476, Sydney, New South Wales± Australia 2001)
5. ASME B46.1-2009 "Surface Texture (Surface Roughness, Waviness, Lay)" (Mechanical Engineer, Park Street III, NY, NY 10016-5990, USA)
6.iso 25178-2 "Geometric-Technical Specification for Products (GPS) – Surface Texture: Zones – Part 2: Terms, Definitions, and Surface Texture Parameters" (International Organization for Standardization (ISO), 1 rue de varembé Post, Case 56, CH-1211, Geneva 20, Switzerland, ±)
7.A. Brown and S. Brown Siegmann, "Basic Scales for Fractal Analysis of Adhesion Area Scales," International Journal of Machine Tool Production, 41 (2001) 1927-1933