As an important mechanical property of rigid films, the characterization of film-based adhesion is an important part of the discussion and analysis of film-based adhesion. The methods applied to the characterization of film-based adhesion include scratch method, tensile method, bending method, scraping method, tape peeling method, friction method, ultrasonic method, etc. Among them, the scratch method is a more commonly used method to characterize the adhesion of film substrates.
In this paper, the method of comprehensive characterization of film-based adhesion is mainly analyzed through scratch experiments. The practical results show that a single AE spectrum or friction curve cannot accurately verify the critical load of the characterization value of the film-based bonding force, and the results of the comprehensive evaluation of the critical load of the AEG, friction curve and scratch morphology are reliable. The results of the WS-92 Scratch Meter measurement verify the accuracy of the MST Scratch Meter evaluation results.
Film-based adhesion is a very important mechanical property of rigid films, and the characterization of film-based adhesion is an important part of its research. The methods used to characterize the adhesion of film base include scratch method, tensile method, bending method, scraping method, tape peeling method, friction method, ultrasonic method, etc. The scratch method is one of the most widely studied methods to characterize the adhesion of film substrates. Many scholars have analyzed the theoretical model of elastoplastic deformation of scratches, scratch failure modes, internal factors (scratch speed, loading rate, indenter diameter and wear, etc.) and external factors (matrix hardness, film thickness, film surface roughness, film and indenter friction factors, etc.) that affect the critical load. The research has been carried out and has made a great contribution to the explanation of the failure of the membrane-based bond and the magnitude of the critical load. The key to characterizing the substrate adhesion by the scratch method is how to determine the critical load, and it is mentioned in the literature that the acoustic emission data obtained from the scratch test, the friction force or the scratch depth and scratch topography can be used to evaluate the critical load. In the literature, the AE spectrum and friction curve were used to analyze the critical load, but the scratch morphology was not used to analyze the critical load. The literature defines the loading load at the crack as a low critical load, and a high critical load when the film is fully spalled.
Researchers have different criteria for using scratch data to determine critical loads, resulting in differences in the results of scratch tests to determine the adhesion of film substrates. In this study, the WC-Co/TNi film-based adhesion prepared by multi-arc ion plating equipment was characterized by the micro-scratch Tester (M-iero.ScratchTester, MST scratch Tester) of the Swiss ± CSM instrument, and how to comprehensively evaluate the film-based adhesion by using the acoustic emission data, friction data and optical and electronic scanning scratch morphology measured by the MST scratch instrument, so as to provide an accurate and credible criterion for the evaluation of the film-based adhesion force.
1 experiment
1.1 Samples
In this study, an AIP-01 vacuum multi-arc ion coating machine was used
Samples of WC-Co/TiN membrane base A, B, C, and D were prepared on a single target equipped with magnetic filters at magnetic filter currents of 3.0A, 3.5A, 4.0A, and 4.5A, respectively.
1.2 Scratch test
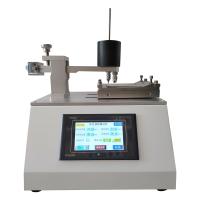
In this study, the ± MST scratch meter was used to evaluate the adhesion force
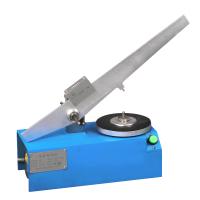
The WS.92 scratch meter of domestic Zhongke Kaihua Technology Co., Ltd. was used to verify the adhesion evaluation. During the test, the MST can collect the acoustic emission signal and tangential friction, and can also observe the scratch topography.
The parameters used on the MST Scratch Meter are as follows.
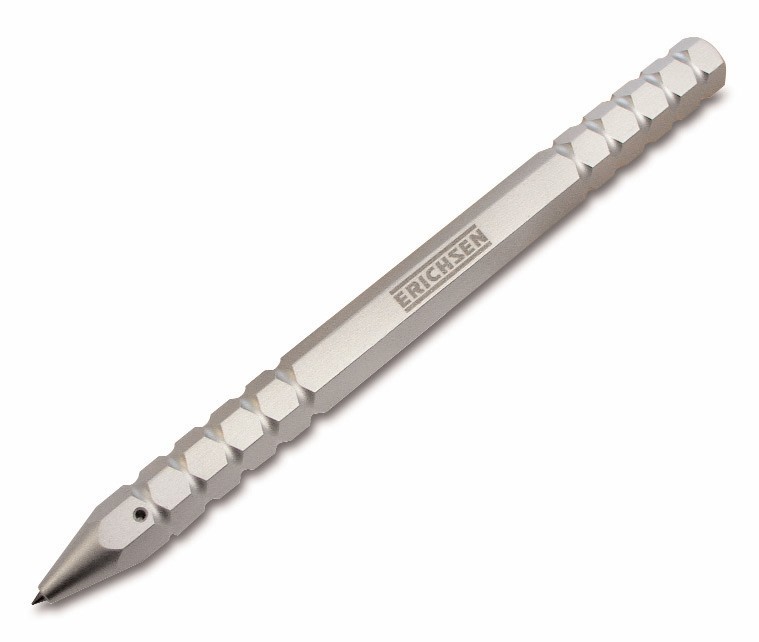
Indenter: Rockwe11 type, diamond, radius of curvature 100mta, coneAngle 120.;
Loading range: 0~28N;
Loading mode: linear stepping;
Loading speed: 9323.33mN/min;
Scratch length: 3mm.
The normal loading load range of WS-92 tracer is large, which is 0—100N, the radius of curvature of the tip of the diamond indenter for loading R=2ogm, and the cone angle is 120o; Only acoustic emission signals can be acquired during the test.
2. Film-based adhesion analysis
When the diamond indenter is linearly loaded with a normal load along the surface of the film, the film will experience microcracks, cracking, peeling from the substrate, plastic failure (furrowing), etc. (hereinafter referred to as bonding failure). However, the interference acoustic signal and the presence of large particles in the arc ion coating film may also produce the AE signal peak, so the normal load at the peak of the AE signal can be used as a preliminary evaluation value of the critical load. When the friction factor is constant, the friction force and normal load curve are straight lines; When the film-based bond fails during the scratching process, the friction factor changes, and the friction force suddenly becomes larger or smaller, and a "knee point" appears on the curve, but the "knee point" will also appear at the abnormal position loading place such as large particles. On the MST scratch meter, the scratch topography at the peak or "inflection point" of the AE signal can be tracked and observed by using an optical microscope to correct the critical load. In this study, three methods were used to comprehensively evaluate the critical charge, namely, the abrupt change of acoustic emission intensity, the change of tangential friction, the inflection point and the scratch morphology.
2.1 Critical load in the event of a sudden change in the intensity of acoustic emission
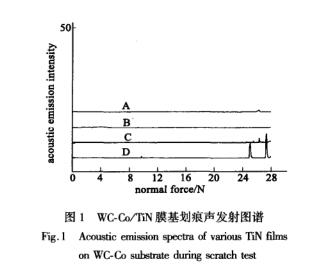
Figure 1 shows the TiN film samples deposited under different magnetic filtration currents.Acoustic emission map of the scratching process on the MsT scratch instrument. As can be seen from the figure, according to the abscissa corresponding to the peak of the acoustic emission signal in the ordinate, the critical loads of the TiN films of samples A and B are preliminarily determined to be 26.2 N and 28 N, respectively. However, there are three peaks of AE signals in sample C and sample D, which correspond to 24.4N, 25.4N, 26.3N, 9.7N, 25.ON, and 27.3N, respectively. There are multiple peaks in the AE spectrum, and the abrupt anomaly of AE intensity is discussed later.
2.2 Critical load when tangential friction changes
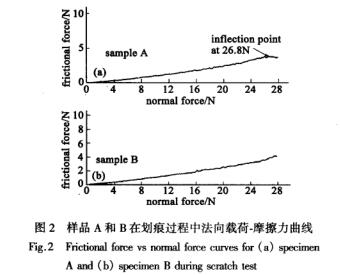
Figure 2(a) is drawn by measuring sample A with an MST scratch instrument
Frictional force. Load curve in the normal direction. At the normal loading load of 26.8 N shown on the abscissa, there is a frictional "inflection point", which is the critical load of sample A. This is 0.6N larger than the value of 26.2N judged by acoustic emission technology, and the difference between the two is 2.2%~2.3%, and the consistency is relatively good. Therefore, it can be considered that in the MST scratch instrument, the film-based adhesion force can be characterized by both the sudden change in acoustic emission intensity and the critical load when the friction force is abrupt.
B, c, D samples normal loading load. The friction curve tends to change
The potentials are basically the same, and Figure 2(b) shows the curve of sample B, which can be used as a representative curve for the three samples. As can be seen from the figure, the friction force is basically increased linearly, and there is no inflection point, so it is determined that the critical load of these three samples is 28N (the limit value of the instrument) or greater than 28N.
2.3 Critical load for scratch topography correction
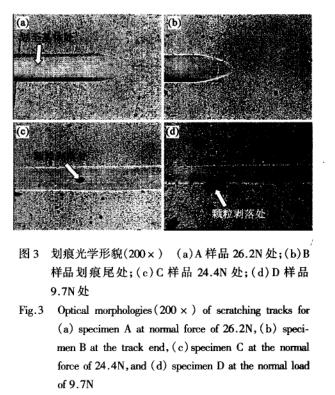
There is only one peak on the AE spectrum of sample A, which correspondsThe normal loading load is 26.2N, and Figure 3(a) shows the scratch topography here, the indenter has been scratched to the substrate as indicated by the arrow, and there is no fragmentation due to the good toughness of the film. The critical load, as determined earlier, is 26.2N, which is the characterization of the membrane-based binding force of sample A. Fig. 3 (b) is the optical microscope morphology of the scratch tail of sample B when the normal loading load reaches the instrument limit of 28N, from the figure, it can be seen that the indenter does not cut the film, the film-based binding force is high, and the film is not scratched at the maximum value of the allowable loading range of the MST scratch instrument, indicating that the film-based binding force of sample B determined by the acoustic emission or friction spectrum is credible (over 28N).
Samples c and D have multiple peaks of abrupt AE intensity, peaksThe values are very far apart (the critical load corresponding to the peak is very different), and there is obviously an anomaly, and the topography of the scratch in the abnormal case is shown in Fig. 3(c) and Fig. 3(d). As mentioned earlier, the abrupt peak of AE intensity for both C and D samples is 3. The scratch morphology corresponding to the first peak at 24.4 N for sample c and the scratch morphology corresponding to the first peak at 9.7 N for sample D were observed under optical microscopy. As can be seen from Figure 3(c), in the case of sample C, there is a hole in the corresponding position of the scratch (indicated by the arrow), around the hole, the TiN film is intact, and the morphology of the hole itself is similar to the traces left by large particles. It can be concluded that the first peak (with a normal load of 24.4 N) due to the sound wave emitted by the diamond indenter ploughing a large particle here does not represent the film-based adhesion, and for the same reason, the second peak (25.4 N) and the third peak (26.3 N) do not represent the film-based adhesion. Judging from the scratch morphology, the film-based binding force of sample C is greater than 28N. Let's discuss the three peaks of sample D. As can be seen from Fig. 3 (d), the normal load corresponding to the first peak is 9.7N, and the corresponding scratch morphology is pointed out by the arrow in Figure 3 (d), plowing up coarser particles, obviously the corresponding abscissa (9.7N) of the first peak does not represent the membrane-based binding force, and from the scratch morphology, the critical load of the second peak is the membrane-based binding force (25N).
From the results of the analysis of the scratch topography above, acoustic emission is presentThe normal load at the abrupt change or frictional "inflection point" is not necessarily the critical load, and anomalies often occur. For the identification of abnormal peak or inflection point, in addition to observing the scratch morphology, you can also see the strength of the sound wave (peak), generally speaking, the diamond indenter cuts the entire membrane, and the sound wave intensity (peak) is very high; If the film is partially damaged, as shown in Figure 3(c) and Figure 3(d), only coarse particles are plowed, the intensity of the acoustic signal is weak or weak. When there are two or more weak peaks on the acoustic emission spectrum line of the same sample, there must be an abnormality, and a judgment should be made in time, and the topography of the scratch should be redone or observed and analyzed with a microscope for correction.
According to the acoustic emission spectrum and friction curve, combined with the scratch morphology correction results, the membrane-based adhesion force was comprehensively evaluated. Taking sample c as an example, there are three abrupt changes in AE on the AE curve C in Figure 1, and the morphology of the optical microscope attached to the MST tracer shows that all of them are peeling off (see Fig. 3(c) for the first place), indicating that the normal load values of these three AE mutations do not represent the characterization value of the film-based binding force, and the critical load should be equal to or greater than 28N. The critical load value judged by the friction curve is also 28N or greater than 28N, so the critical load of the membrane base of sample C is at least 28N. After comprehensive evaluation, the critical loads of the characterization values of film-based adhesion in samples A, B, C and D were 26.2, 28.0, 28.0 and 25.ON.
Comparison of 2.4M_fir Scratch Meter and WS.92 Trace Meter measurements
The four samples A, B, C, and D prepared in this study were scratched with /VISTThe critical load film (base binding force) measured by the instrument is 25.0~28.ON, while Shi Xinwei uses the WS.92 scratch meter to measure the base binding force of the film base up to 90N [13], the values of the two are very different, but they are comparable and should be clarified
。
The relationship between the two. According to Ref. [14], the value of the critical load measured by the scratch method is proportional to the square of the radius of curvature of the indenter. The radius of curvature of the indenter used in the MST scratch meter is 1OOpan, and the radius of curvature of the indenter used in the WS-92 instrument is 200ttm, and it can be calculated that if the critical load value measured by MST is 28N, the critical load value measured by the WS-92 scratch meter is 112N.
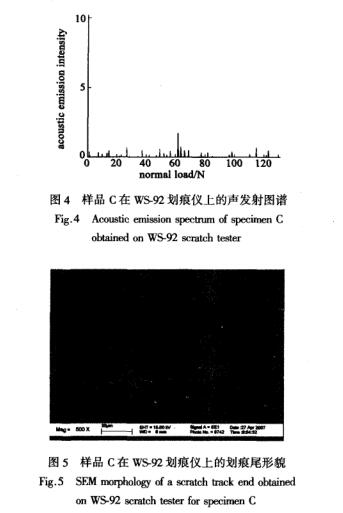
The WS.92 instrument was used to verify the membrane-based adhesion force, and the C sample was scratched on the WS192 instrument, the acoustic emission spectrum is shown in Figure 4, and the SEM morphology of the scratch tail is shown in Figure 5, and it can be seen from Figure 4 that there is no peak emission intensity until the limit (1ooN) of the WS-92 instrument. As can be seen from Figure 5, the topography of the scratch is intact without any traces of damage, and it can be concluded that the critical load of the characterization value of the membrane-based adhesion force of sample C is greater than 100 N, which is consistent with the above conversion value of 112 N.
The critical load evaluation values of samples B and c have exceeded the test limit value of MST scratch meter (or greater than 100N), but the excellent degree of the two samples can be compared, and the integrity of the scratch can be observed with a microscope, and it can be inferred that the binding performance of sample c is better than that of B, which still needs to be further determined.
3 Conclusion
The scratch method could not accurately characterize the bonding force of the substrate by using only the acoustic emission spectrum or the friction curve, so the acoustic emission spectrum, the friction curve and the scratch morphology were comprehensively evaluated by the membrane-based bonding force, and the results were more accurate and credible.
The wc-Co/TiN film-based adhesion force was analyzed by the acoustic emission spectrum and friction curve of the MST tracer, and the scratch morphology was corrected, and the scratch test was compared with the WS.92 instrument, and the results were consistent with the results of the lVIST scratch test, which verified the credibility of the scratch method in the comprehensive evaluation of the film-based adhesion force.