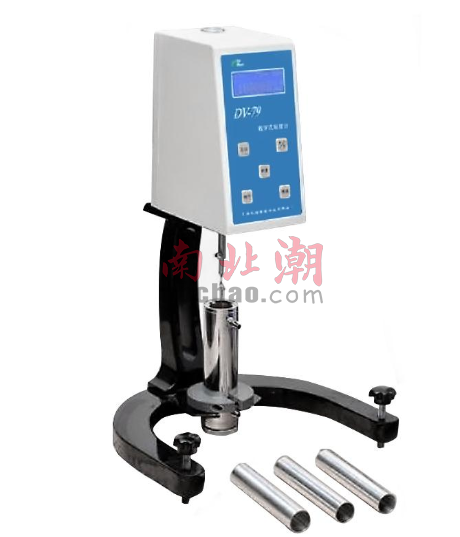
The icon functions of Nirun Rotational Viscometer DV data acquisition and program-controlled analysis software are introduced as follows:
1. Set experiment environment icon
Click the [Set Experimental Environment] button to enter the experimental parameter setting interface, and fill in the sample name, operator, sample sending unit, testing unit, remarks and other information in turn. Press the [OK] button when finished.
Note: The experimental parameter setting can be completed before starting the sampling, or can be completed by adding a label button after the sampling curve data is processed.
2. Reset experiment environment icon
Click the [Reset Experimental Environment] button to initialize the experimental environment, which can also be understood as restarting the sampling interface.
3. Open sample curve icon
Click the [Open Sampling Curve] button to enter the interface for opening the curve data bar.
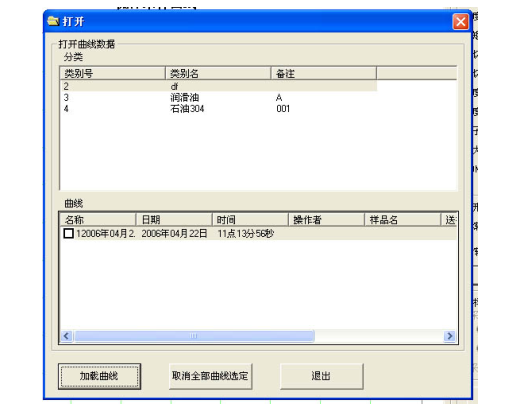
By clicking the category name in the classification column and ticking the box of the curve column name, and clicking the [Load Curve] button, the work of opening the sampling curve can be completed.
Note: Loading curves can load multiple curves, as long as you tick the name box in the curve column. Multiple curves are used to display and compare the repeatability of the sample and distinguish mutations in special states.
4. Save sample curve picture icon
Click the [Save Sampling Curve Picture] button to save the sampling curve as a picture in *.jpg format, which is convenient for users to use the picture in various occasions.
5. print preview icon
6. Click the [Print Preview] button to enter the print preview interface, where you can adjust page settings, print copies, and zoom ratio adjustments. And it can print out the title of the report sheet with the results of the SNB series viscosity measuring instrument.
7. print icon
Click the [Print] button to directly print the fluid sampling curve test result report.
8. open measurement window icon
Click the [Open Measurement Window] button to display the measurement window directly and return to the measurement waiting state.
9. start sampling icon
Click the [Start Sampling] button to sample and record various data information of the sample.
10. stop sampling icon
Click the [Stop Sampling] button, and stop sampling can also be understood as the end of sampling.
11. Restoring Graphics Icons
When the sampling curve graph is not adjusted properly, you can click the [Restore Graphics] button to restore the original record graph practice.
12. Mark peak icon
点击【标记峰值】钮,图面上会出现 L、R 左右二条光标,通过左、右二条光标范围调整来寻找曲线峰值,左、右二条光标范围确定后,点击【数据处理】钮,可标出该范围内峰值。
13.标记谷值图标
点击【标记谷值】钮,图面上会出现(L)、(R)左右二条光标,通过左、右二条光标范围调整来寻找曲线谷值,左、右二条光标范围确定后,点击【数据处理】钮,可标出该范围内谷值。
14.当前值图标
点击【当前值】钮,图面上会出现(M)一条光标,通过光标移动即时寻找曲线 X、Y值,点击【数据处理】钮,可标出该点 X、Y 值。
15.平移图标
点击【平移】钮,图面上会出现(M)横线光标,用户点击所要移动采样曲线,使点击采样曲线变(红)色,然后移动(M)横线光标到所需的位置,点击【数据处理】钮,采样曲线就会平移到所需的位置上。
注:平移前更好把各条采样曲线进行图形缩小,然后点击所要移动采样曲线变(红)色,移动(M)横线光标到所需的位置,点击【数据处理】钮,采样曲线就会平移到所需的位置上。重复以上步骤,把各条采样曲线移动到合理位置进行比较分析。
16.平滑图标
点击【平滑】钮,图面上会出现平滑次数栏界面,输入平滑次数,点击【确认】钮,完成采样曲线平滑。平滑次数少,采样曲线平滑效果越差,反之,采样曲线平滑效果越好。一般不要超过 10 次。
17.剔除坏点图标
点击【剔除坏点】钮,图面上会出现(L)(R)两条横线光标,用户点击移动这两条光标,两条光标所包含的数据为用户想保留的数据,落在两条光标以外的用户数据为用户想剔除的数据,点击【数据处理】钮,计算机自动把光标以外的数据从曲线当中剔除。
18.数据处理图标
【数据处理】钮要结合其他按钮一起使用。
图形工具
1. 添加标签图标
点击【添加标签】钮,图面上会出现添加标签栏界面,用户可以在打印采样曲线图面上添加所需的标签,完成后按【确认】钮。所添加的标签,通过右键单击标签,选中功能菜单项,可以删除或者修改标签。
2.取消全部结果标记图标
点击【取消全部结果标记】钮,就可取消采样曲线图谱上全部结果标记。
曲线数据管理
1.管理曲线图标
点击【管理曲线】钮,图面上会出现曲线数据管理栏界面,

2. 创建分类钮,可以为操作者、样品批次、样品名称创建分类,方便用户快捷找到所需的采样曲线。
3. 修改分类钮,为创建好的分类信息进行修改。
4. 删除分类钮,删除创建好的分类信息。
5. 删除曲线钮,删除采样曲线数据,在曲线的栏框中,点击要删除采样曲线名称,再点击删除曲线按钮。
6. 修改曲线信息
7. 曲线重新归类,先点击分类栏里类别名,再点击曲线栏里要重新归类曲线名称,点击曲
线重新归类按钮,中间 激活,点击新类别名,再点击 即可完成曲线重新归类。
8. 导出曲线钮,可将存盘的采样曲线复制到用户的目标盘里。
9. 导入曲线钮,可将目标盘里的数据导入到计算机中。
设置图形格式
1.设置图形格式图标
点击【设置图形格式】钮,图面上会出现属性设置栏界面,
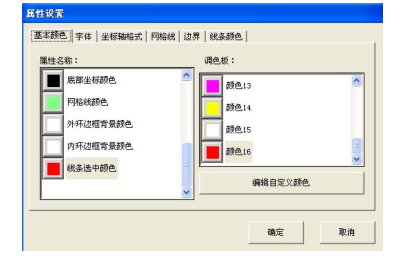
2. 基本颜色
Users can change the graphic color from the attribute name column according to their own environment needs. To change the grid line color, first click the grid line color bar, select the color to be changed in the palette, such as color 9, and click it, and finally press the OK button to complete the grid line color change. Other change items include line selection color, inner and outer border background color, bottom, top, right, and left coordinate colors, and bottom, top, right, and left title colors.
3. font
Users can change the bottom, top, right, left title font, bottom, top, right, left scale font.
4. Axis format
User can change bottom, top, right, left format. Coordinate scale value range, scale division, and decimal places.
5. Gridline Properties
Users can change grid line type, grid line width, number of horizontal grid lines, number of vertical grid lines, coordinate boundary type.
6. boundary
Users can change the distance between the left and right borders and the top and bottom borders of the page as needed.
7. line color
Users can change the line color of the sampling curve as needed to distinguish them.