With the development of the wheat flour processing industry, the first impression of consumers on noodles is the color, which directly affects people's judgment on the quality of noodles, and the color of noodles has gradually become an important sensory evaluation index. At present, sensory evaluation is still the main noodle quality evaluation method. However, the sensory evaluation of noodles has higher requirements for tasters, and there are many factors affecting the evaluation. The identification results may vary completely in different regions and different laboratories. Measuring the color of noodles with a color difference measuring instrument helps to objectively evaluate the quality difference of noodles and reduce human errors.
At present, the commonly used method to express color is the L*a*b* color space method, where L* is the brightness of the sample color; a*b* is the color direction, +a* is the red direction, -a* is the green direction, +b * is the yellow direction, -b* is the blue direction. Not only can it be used to test the whiteness of flowable powder wheat flour, but it can also give an objective quantitative evaluation of the surface whiteness, brightness, and internal structure whiteness and gloss of finished noodles. Through the comprehensive L*, a* and b* can comprehensively reflect the deviations in surface color or internal organization of noodles, noodles and other foods, so as to compare the color difference between different samples more accurately. And through the color measurement of wheat flour, raw and cooked noodles, the application of Spectrophotometer in the sensory evaluation of noodle color was studied.
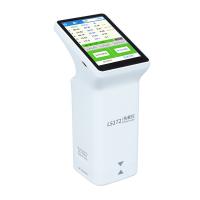
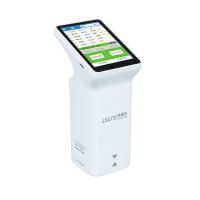
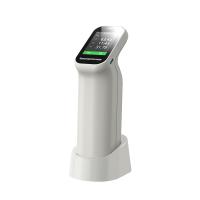
222 representative wheat samples were selected for the experiment. Wheat samples were distributed to 108 wheat varieties in 10 provinces in the main wheat producing areas of the country, and the wheat flour was processed into noodles for sensory evaluation. The experimental instrument adopts CS-600 Spectrophotometer .
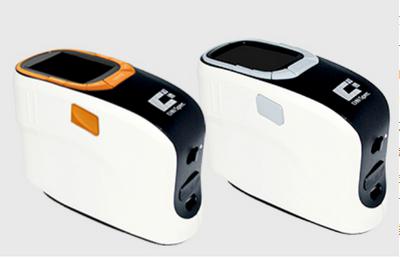
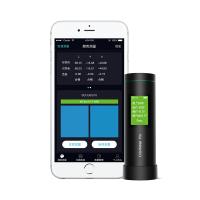
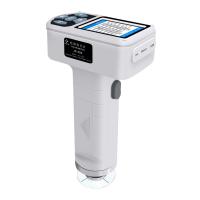
Spectrophotometer
Spectrophotometer is a special tool to directly measure the color of noodles. We use noodles instead of noodles. Take the two freshly made dough pieces and put them into a sealed bag, store them in a 25°C Incubator, measure the color of the raw dough pieces after 0.5 h and 24 h respectively; put the dough pieces left for half an hour into boiling water Cook for about 6 minutes, take it out and immerse it in ice water for 10 s, and measure its color as the color of the noodles after cooking; take the noodle slices for each sample and measure 3 times, and finally take the average value (noodles with good color should be bright yellow or bright white) ).
The statistical values of the samples are shown in Table 1. It can be seen that after the raw dough is left for 24 hours, the L value of the dough decreases, the a value increases, and the b value does not change much. It shows that with the prolongation of the storage time of the raw dough, the color of the dough changes to dark and red. The standard deviations of L value and a value increased and the b value decreased after the raw dough was placed for 24 hours, indicating that the prolongation of the storage time will enlarge the difference of L value and a value between samples, and reduce the difference of b value between samples .
Table 1 Statistical values of various indicators of samples
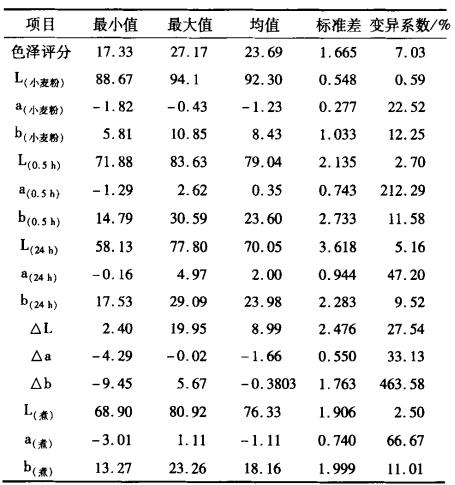
Note: (wheat flour) is the color of wheat pink; (0.5 h) is the color of the dough after 0.5 h; (boiled) is the color of the dough after cooking; (24 h) is the color of the dough after 24 h; △L=L (0.5 h)-L(24 h); △a=a(0.5 h)-a(24 h); △b=b(0.5 h)-b(24 h).
After the raw noodles are cooked, the three indicators are all reduced, the noodles will become darker, and the red and yellow will be reduced. After cooking, the standard deviation of L value and b value of the slices decreased, but the standard deviation of a value remained unchanged, indicating that the difference in color between the slices was reduced after cooking.
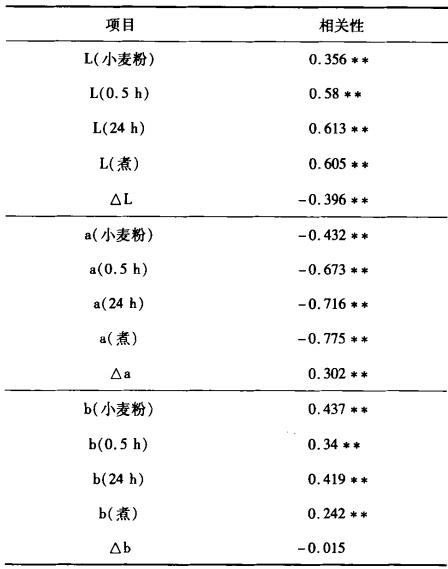
As shown in Table 2, there is an extremely significant correlation between the test value of wheat pink color and the sensory score, in which the a value of wheat flour is negatively correlated with the sensory score, and the L value is positively correlated with the b value, indicating that the sensory score of wheat flour with high brightness, yellowish and low redness value high. All the data of the color of the dough were significantly correlated with the sensory score. △L had a very significant negative correlation with the sensory score, and the change range of the L value after the noodles were placed for 24 hours was small, and the noodle color score tended to be relatively high; △a had a very significant positive correlation with the sensory score, where △a was negative This also shows that the smaller the variation range of a value, the higher the noodle color score. It can also be seen from Table 2 that the noodles with higher color scores were left for 24 h.
Table 2 Correlation analysis of wheat pink color, noodle color and noodle sensory evaluation color score
Multiple linear regression equations were established using stepwise regression. Seven multiple regression equations were established, and the color difference meter was used to replace the color score in the sensory evaluation. The coefficient of determination R2 of the regression equation listed with raw noodle slices at 0.5h, 24h and boiled noodle slices as independent variables was 74.1%.
Table 3 Multiple linear regression analysis
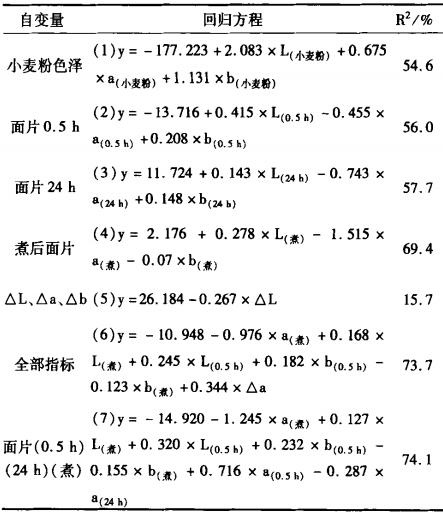
The color of wheat flour can predict 54.6% of the color of noodle sensory evaluation. Comparing the above 7 equations, the accuracy of equation (7) is high, reaching 74.1%, but it is necessary to test the color of the raw dough after 0.5h and 24h. Considering the simplicity of the test operation and the effect of the equation prediction, the equation ( 4) Instrumental evaluation for noodle color. The multiple regression equation (4) could explain 69.4% of the total variation in noodle sensory evaluation color scores.
Table 4 Statistical comparison between equation value and actual value
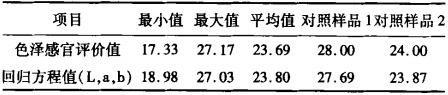
It can be seen from Table 4 that Equation 4 can well replace the color in the sensory evaluation of noodles. Bring the color L, a, and b of the cooked sheet of the control sample into Equation 4, and the result of the equation is the same as the color value of the sensory evaluation. Therefore, the equation (4) composed of the color of cooked noodles can be selected: color Y=2.176+0.278×L(boiled)-1.515×a(boiled)-0.07×b(boiled) for the instrumental evaluation of noodle color. This equation can replace the naked eye to evaluate the color of noodles.