Sunlight contains short-wave ultraviolet and visible and infrared energy. UV light is the primary cause of ink degradation, with temperature and humidity being secondary stressors that can accelerate the rate of degradation.
Lithographic inks can experience harsh sunlight near windows, or worse, car dashboards with high UV rays, heat, and humidity during the summer months. The testing sites in Florida and Arizona were chosen for this study because they provide these extreme environments (Figure 18.1).
1. Test experiment
The Graphic Arts Technology Foundation (GATF) selected eight widely used lithographic ink colors: Yellow No. 1, Yellow No. 2, Yellow No. 3, Magenta, Violet, Orange, Red, and Violet (Figure 18.2). A Little Joe proofer was used to create prints at typical offset film thicknesses. The inks are printed on a typical coated, 70lb plain paper substrate. Repeat printing is done for each ink color for all exposures.
Ink test samples were tested by Q-Lab Weathering Research Services located in Florida and Arizona. They are placed in glass-covered cabinets, slanted 45 degrees to the south to maximize exposure to sunlight filtered through the window glass (Fig. 18.3). The spectrum of sunlight through window glass was chosen because it best represents the worst indoor lighting conditions.
The color change of the ink test samples was measured before, during and after exposure. Color measurements were performed with a Spectrophotometer according to ASTM D2244. The total color change, expressed in delta E units, was recorded for each specimen. Exposure testing in Florida began at four seasonal intervals: autumnal equinox (9/21/02), winter solstice (12/21/02), spring equinox (3/21/03) and summer solstice (6/21/03). Exposure testing in Arizona began in the fall (10/7/02).
Table 18.1 shows the total light intensity (i.e., radiation dose) in MJ/m² 90 days after the completion of the various outdoor exposure tests in Florida and Arizona.
Figure 18.4 shows the fade resistance of eight ink colors during Florida fall exposure. Some ink colors have very good fade resistance and some ink colors have poor fade resistance. After 90 days, most of the ink samples faded seriously and could not be used for analysis.

Figure 18.2 Eight representative lithographic ink colors were selected by GATF technicians for fade resistance testing on standard substrates.
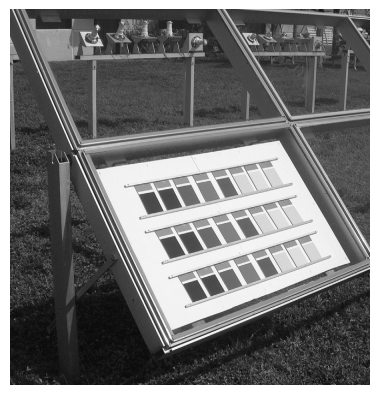
Figure 18.3 Ink samples were placed in ASTM G24 glass-covered exposure racks at the Florida and Arizona benchmark sites.

Figure 18.4 Range of fade resistance for eight colors.
At 35 days, however, the inks exhibited a wide range of fade resistance from excellent to poor. Therefore, 35D was chosen to evaluate the performance of inks under various outdoor exposure conditions.
Figure 18.5 shows the range of durability for three yellow ink test samples under Florida fall exposure. Although the three yellow inks have the same color, they have significant differences in fade resistance. Yellow A performs much better than Yellow B or Yellow C because Yellow A is fade resistant and suitable for fine art reproductions or outdoor applications, while Yellow B and C are suitable for general commercial printing.

Figure 18.5 Range of Fade Resistance for a Color

Figure 18.6 Correlation of fade resistance in Florida: fall versus winter.
2. The influence of seasonal changes
Since the natural exposure time was only 35 days, the experiment was repeated at seasonal intervals to determine the effect of different times of the year on degradation. Results showed that season had no effect on fading resistance rankings. Seasonal exposures were correlated in rank. However, the degradation rates vary.
To quantify differences in seasonal degradation rates, mean delta E (35 d) can be compared. For example, the average delta E value for all inks exposed in Florida in the winter was 21, while the delta E value for all inks exposed in Florida in the fall was 44. In this case, autumn exposure was about 2 to 1 more severe than winter exposure. One should not compare absolute values for specimens exposed at different times of the year because exposure rates vary seasonally. This inconsistency may not be a factor when using accelerated fading testing equipment.
Figure 18.6 compares Florida's fall (35 d) and winter (45 d) exposures. There was a good order correlation between the two groups of exposures.
Figure 18.7 compares Florida winters (45 days) and . Florida Summer (35 days). There is a good ranking order (1.0) between the two seasonal exposures.
3. Exposure
Exposures in Arizona closely correlated with exposures in Florida. The Arizona exposure showed rapid test results at the same time (35 days) as the Florida exposure. Figure 18.8 compares Arizona and Florida at 35 days. It can be seen from Table 18.2 that the rank correlation values of all outdoor exposures are 0.90 and above.
